In the era of Information overload, data can talk and communicate powerful stories. Here is what we did while building an Aid Transparency portal for a large Non Profit, communicating using data made the portal “Come Alive” and present to the users the impact of the work done by the organization.The approaches implemented include:
- Use of Data Highlights
- Intuitive Search Interface
- Data Visualization
- Use of Animation in Design
Aid Transparency is about presenting data around donors, funds received, fund utilization/expenses, areas of impact in a transparent manner. The first step was a study of the customer’s domain and the work carried forward by the customer organization. Understanding the donors, the impact areas, the funds received, funds utilized, regions in which they work. Mapping all the key parameters of the underlying data, their meta information and their inter-relationships.
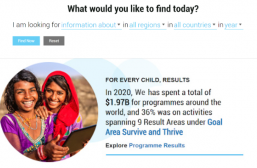
A sitemap was defined to communicate the different perspectives of the data like: pages on fund utilization, pages that were contribution/donor specific, pages that detailed the resource utilization, etc. The best graphical visualization was identified for these pages. Yet some of this graphical information could be overwhelming for visitors who do not relate to the representation and numbers. To further simplify this, a layer of Data Highlights was introduced. The Data Highlights represented a one line story around the data that was presented and was much easier for a lay user to understand. These Data highlights were presented on the homepage and across the site.
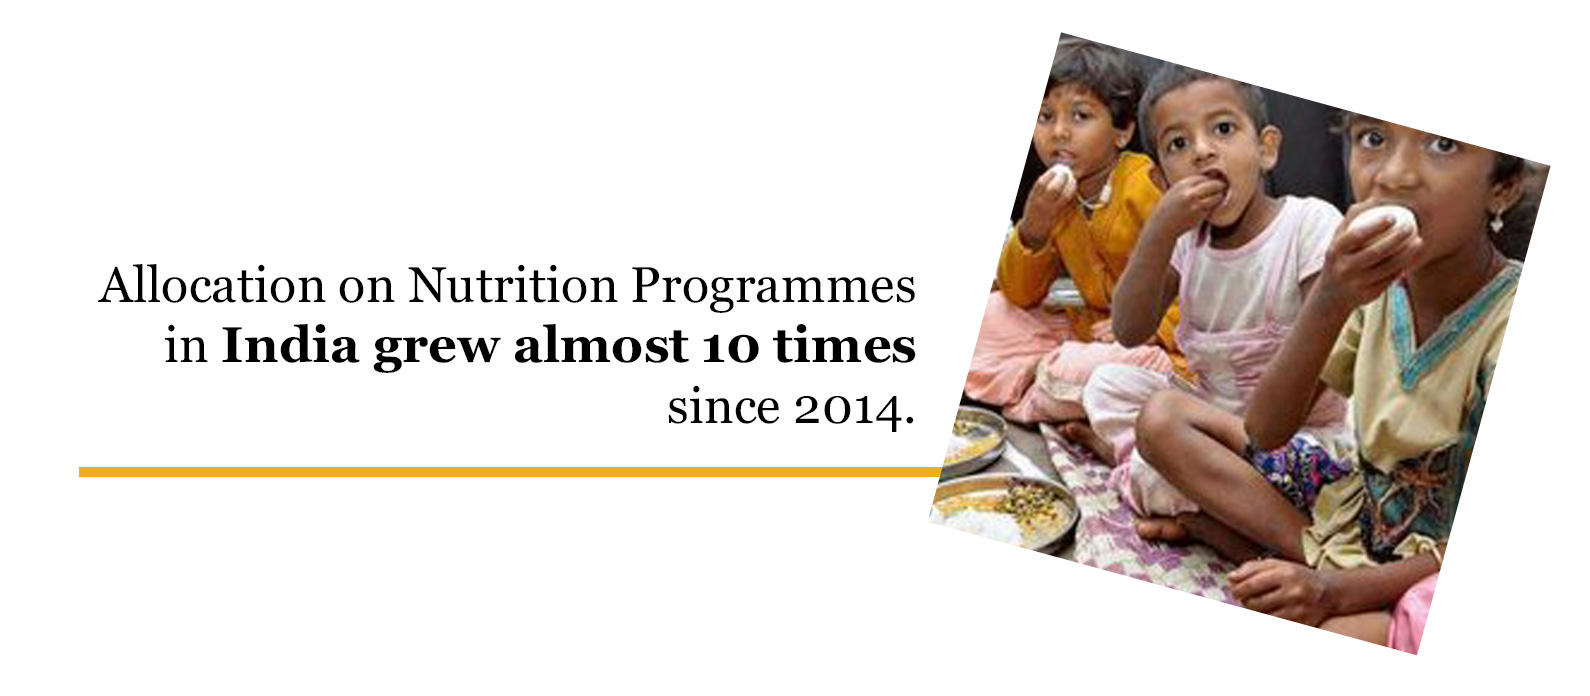
Above is a sample Data Highlight that leads to a page that allows you to see the utilization of funds, based on the area of impact, region and year.
Intuitive Search Index
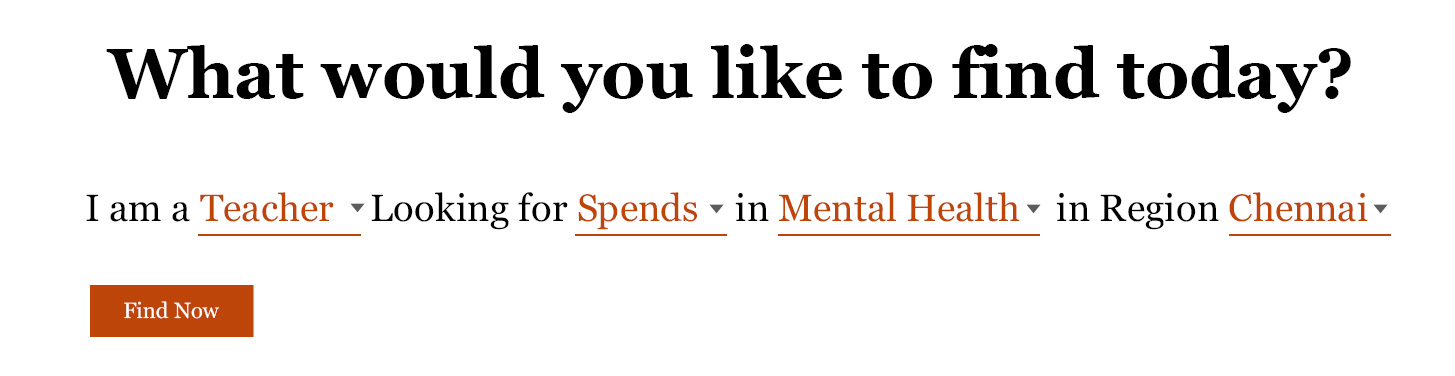
A very important feature on a data-intensive site are the Search Interfaces. To make them intuitive, Narrative based Search Interfaces were implemented.
On the homepage a Natural Language form was used to identify the type of the audience and understand the area of interest of the user to direct the user to the exact section in the site that would meet his needs.
In scenarios where distribution of data needs to be presented across locations or location is one of the key attributes, using Maps to present the data helps the user to drill down to the location of choice.
Data Visualization
Effective use of Bar-charts, Doughnut charts, Sankey Flow diagrams, Maps were used to present data. The Visualization of data makes it easier for the user to understand the data and each of them represents a particular Data Story.

- Bar charts are used to compare categorical data. They are oriented vertically instead of horizontally. The main advantage of bar charts is that it is better with many categories, especially on a small screen, as the height can be adjusted to show all categories.
- Donut charts are the same as a pie chart, but by only displaying an area along the outer edge of the pie, it becomes easier to compare the elements to each other. These are used to present the data as a percentage of sum total as 100%. In Donut charts, the space in the middle could also be used to communicate additional information..
- A Sankey diagram is a type of flow diagram, in which the width of the link between two nodes is shown proportionally to the flow quantity. Here this is used to depict the flow of Funds from Donors to area utilization or to type of supplies used.
- Map Charts are used when we need to show distribution across geographies. In this case both impact and fund utilization across geographies is presented using maps. Additionally Map also serves as a navigation tool to zoom in to identify the destination the user is looking for to get more specific information.
Use of Animation in Design
The home page used a video in the background to tell the story about the organization. Simple Animations on the page helps to bring the page alive. In the Data Visualization some of the popular Animations used were timeline animations, growing bar charts, rotating pie charts. These animations helped amplify the Data Story put forth by the visualizations.
This Site has been built using Drupal Solr and Highcharts.